Cell count automation isn’t as easy as I expected, and I’ve learned quite a bit in the processes getting it to work well. Hopefully what I’ve figured out will help you to be automatically counting yeast cells and viability in less time than it took me!
Sample Preparation
It takes more than fiddling with the algorithm settings in
ImageJ to get good results. It all starts with sample preparation. The cells should not be clumped up and should
be sparse across the field of view. If
you aren’t staining for viability 5% acetic acid (white vinegar) can be used to
unclump the cells. Unfortunately most
viability stains, such as Methylene Blue and Trypan Blue are very sensitive to
pH and will not be absorbed by the cells at a low pH. Alternatively malt extract can be used. In the presence of fermentable sugars yeast
will naturally separate in order to create more surface area to metabolize the
sugar. For a good image of the yeast the
cells should also be sparse enough to make counting easy. 50-200 cells in the field of view is a good
target. This corresponds to a cell
density of about 10 to 50 Billion cells per liter which will appear slightly
turbid in a test tube.
If the foreground stands out well from the background ImageJ
can better differentiate the cells.
Contrast can be enhanced by staining.
Some common stains are as follows:
- Methylene Blue - Stains dead cells blue. A one to one ratio of cell suspension and a 0.1% solution is commonly used.
- Iodine - Stains cellular glycogen brown. The intensity of the color is proportional to the glycogen content. 0.2% solution is commonly used. [1]
Imaging
It’s possible to take a picture through a microscope by
holding a camera at just the right spot over the eyepiece, but it’s very hard
to take a good image this way. The
simplest way to get a good picture is by purchasing a USB microscope
camera. An alternative is to use a
camera adapter for your cell phone. Most
cell phones have pretty nice cameras.
The iPhone camera is certainly better than most web cameras, and even
better than most USB microscope cameras.
If you have it, why not use it?
To solve this problem I used a 3D printer to make one. It attaches to the eyepiece and uses rubber
bands to attach to the phone.
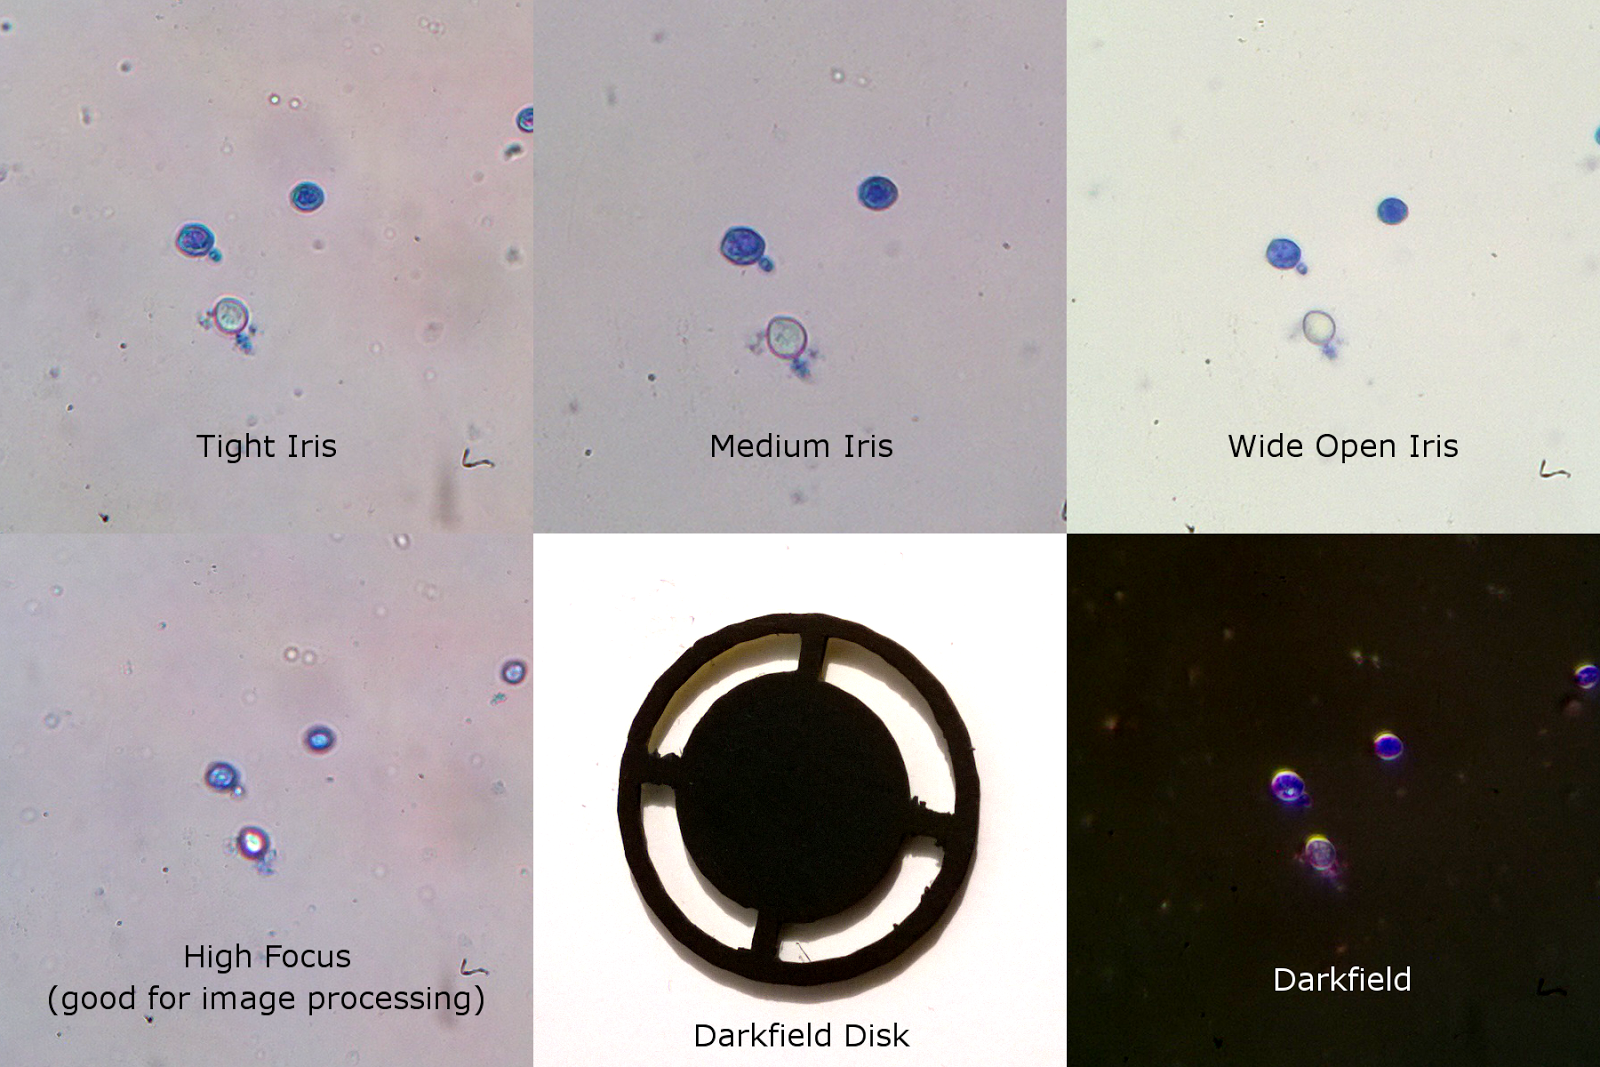
Brightfield imaging works well if the microscope is setup
well. Darkfield provides a more crisp
image, but color is difficult to distinguish.
A dark field accessory is available for many microscopes. For mine I printed a disk that can be placed
in the light path normally used for color filters.
Some tips for getting a good image:
- Use a fixed focal length on your camera of about 10”
- Zoom in on the camera as far as possible then adjust focus on the microscope
- Adjust focus on the camera if needed.
- Zoom out on the camera so that most of the field is in view.
- Turn the brightness setting on the camera down (I use -1) to compensate for the black corners of the image.
- Use a low iso and long exposure time for the best image quality.
- Adjust the iris aperture to accentuate the cell membrane, but not so much as to entirely loose the cell color. (Mine is normally almost closed)
- Adjust the focus so that the centers of the cells are bright, but not so bright that the color is washed out.
- Take a picture of an empty field to be used for the background removal.
Algorithm
It can take hours and hours to really hone a process, and
can be quite frustrating if you are working with poor images. I’ve played with this for way more hours that
I should have, and come up with the following procedure:
- Make a background image by blurring a copy of the specimen image.
- Subtract the background with the image
- Connect the shapes with maximum, minimum and blur functions.
- Make a mask by using the Auto Threshold function.
- Find the particles and add them to the ROI manager
- Make the measurements.
Place these files in your ImageJ macro directory to use them. The "Batch Yeast" macro processes all of the images in a folder with the "One Yeast" Macro. The results are saved in a coma separated log file as well as annotated images. Cells detected as being alive are circled in white, dead cells are circled in blue, and trub is boxed in red.
The FIJI build of ImageJ can be downloaded here:
http://fiji.sc/Downloads
The FIJI build of ImageJ can be downloaded here:
http://fiji.sc/Downloads
[1] V.E. Chester, Heritable Glycogen-storage Deficiency in
Yeast and its Induction by Ultra-violet Light. 1967 J. gen Microbiol (1968),
51, 49-56
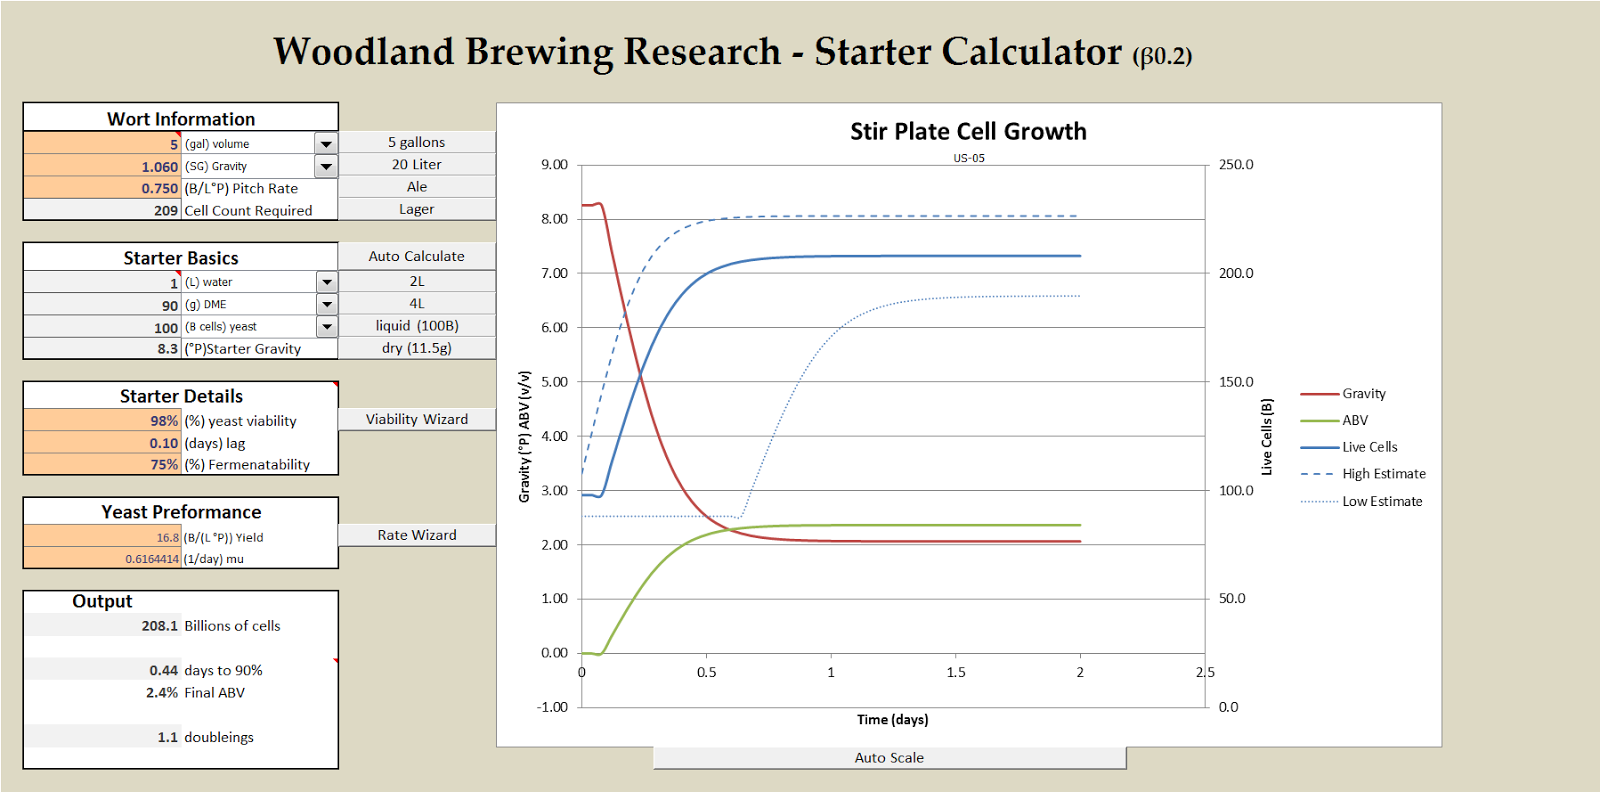
 Download the Starter Calculator
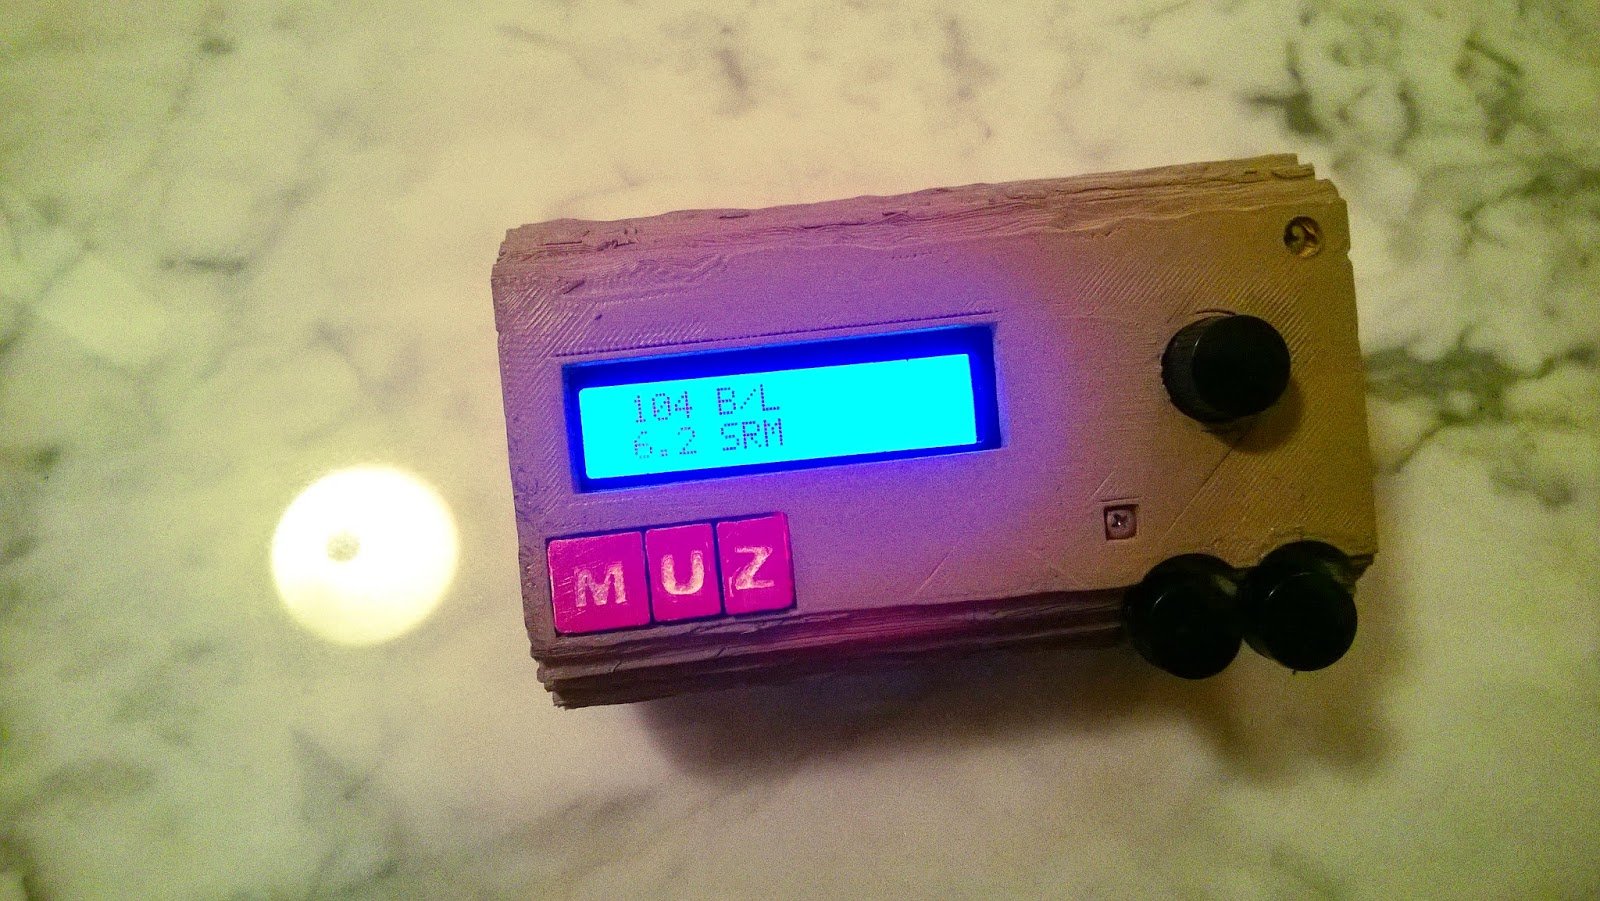
 Agitation Effects on Growth Rate and Yield of Brewer’s Yeast
 Yeast Growth Fermentation Model Download